Chapter 33: A Redraw Cookbook
In the previous chapter we got our Results window up and running, storing data and displaying it to the user. The use of Wimp_PlotIcon for drawing the window contents worked well for the tabular nature of the content, and we will be sticking with it going forward.
There are, however, many other ways to plot window contents. The ‘correct’ one to use will depend a lot on what that content is, how it appears to the user, and individual developer preference – and there will inevitably be more than one valid way to solve most problems. Before we move on to other things, we will have a quick look at some of these to show what else is possible and introduce a few useful tools to have on hand.
Free textops
If we need to plot text in a window, without the need for icons but using the desktop font, then Wimp_TextOp is a handy SWI to know about. It only arrived with the RiscPC in RISC OS 3.50, so it isn’t one for the retro audience, and the exact options on offer vary depending on which branch of the OS you’re on. Despite that, the core functions are useful and, if you’re requiring the Nested Wimp for any reason, it comes for free with that.
Its purpose is to manipulate text in the desktop font, switching seamlessly between outline and System fonts. It’s one of those SWIs which takes a reason code in R0 to determine exactly what it does, and from the start we had three routines at our disposal.
- Wimp_TextOp 0 sets the foreground and background colours for the current Wimp_TextOp 2 plotting operation, using &BBGGRR00 values.
- Wimp_TextOp 1 calculates the width of a string in OS units using the current desktop font, with the option to include only the first n characters. This can be very useful for working out how to wrap or truncate text.
- Wimp_TextOp 2 plots a string to the screen in the current desktop font, and is the one that we’re particularly interested in here. It must be used from within a redraw loop.
If you’re targetting RISC OS 5 or a recent version of Nested Wimp, then a couple of additional opcodes give useful variations on Wimp_TextOp 1. Wimp_TextOp 3 will take a string and, given a width in OS units, return the offset in characters of the necessary split point if splitting at a specific character. Wimp_TextOp 4 will take a string and a width in OS units and, given a suitable output buffer, write a string which will fit the available space when truncated with three full stops or an ellipsis.
For plotting our text, Wimp_TextOp 2 is the one that we need. OSLib defines it as follows:
extern void wimptextop_paint(
        wimptextop_paint_flags flags,
        char const *s,
        int x0,
        int y0
);
It takes a pointer to a string *s, x0 and y0 coordinates of a point on the baseline of the text, and some flags to control how these values are interpreted.
#define wimptextop_VJUSTIFY             ((wimptextop_paint_flags) 0x10000000u)
#define wimptextop_OFFSETS_FOR_REDRAW   ((wimptextop_paint_flags) 0x20000000u)
#define wimptextop_GIVEN_BASELINE       ((wimptextop_paint_flags) 0x40000000u)
#define wimptextop_RJUSTIFY             ((wimptextop_paint_flags) 0x80000000u)
The wimptextop_GIVEN_BASELINE flag indicates that the y0 coordinate should be adjusted so that System and outline fonts appear to use the same vertical baseline. The text will usually be plotted left-aligned to x0, but if wimptextop_RJUSTIFY is set then it will be right-aligned to this point instead. The other two flags aren’t mentioned in the Programmer’s Reference Manual or the StrongHelp Manuals, but the ROOL Wiki indicates that wimptextop_VJUSTIFY will cause the text to be vertically centred on y0 while wimptextop_OFFSETS_FOR_REDRAW causes the supplied coordinates to be treated as work area coordinates in the same way as with Wimp_PlotIcon. It isn’t clear on which versions of RISC OS these latter two flags can be used, but it may be fair to assume RISC OS 5.
Armed with this information, we can replace our results_plot_icon() function with a new results_plot_text() as seen in Listing 33.1. Superficially this looks similar to its predecessor, but there are some significant changes that we will need to investigate.
#define RESULTS_LINE_INSET 12

/* Plot a piece of text in the redraw loop. */

static void results_plot_text(wimp_i icon, int ox, int y, char *text)
{
        wimptextop_paint_flags flags = wimptextop_GIVEN_BASELINE;
        int x;

        if (icon == RESULTS_ICON_TITLE_SHAPE) {
                x = ox + results_icons[icon].extent.x0 + RESULTS_LINE_INSET;
        } else {
                x = ox + results_icons[icon].extent.x1 - RESULTS_LINE_INSET;
                flags |= wimptextop_RJUSTIFY;
        }

        wimptextop_paint(flags, text, x, y + RESULTS_LINE_INSET);
}
Listing 33.1: Plotting text with Wimp_TextOp
The function still takes an icon, but instead of being a template to use with Wimp_PlotIcon this is now an icon from the title row to use for positioning. The ox parameter is the screen coordinate of the horizontal work area origin, which we introduced a couple of chapters ago. On the other hand, y is the vertical screen coordinate of the bottom of the row in which we want to plot the text. Unlike Wimp_PlotIcon, Wimp_TextOp 2 works in screen coordinates unless we set the wimptextop_OFFSETS_FOR_REDRAW flag, and so there are no work area coordinates here. The *text parameter continues to point to the text to be plotted, however.
We want to plot on a standard baseline, so we initialise flags with wimptextop_GIVEN_BASELINE set. All of the columns in our window are right-aligned apart from the Shape column, so we test for this and treat it as a special case. If we are in the left-aligned column, then
x = ox + results_icons[icon].extent.x0 + 12;
takes the screen coordinate of the horizontal work area origin ox and adds the work area coordinate of the left-hand side of the icon in order to get the screen coordinate of the left-hand side of the column. It then adds on a constant inset value to provide some margin around the text. For all of the other columns, which are right-aligned,
x = ox + results_icons[icon].extent.x1 - RESULTS_LINE_INSET;
flags |= wimptextop_RJUSTIFY;
does a similar thing but uses the right-hand side of the icon in order to get the screen coordinate of the right-hand side of the column. The constant inset is subtracted so that it insets the text in from the right, and the wimptextop_RJUSTIFY flag is set to tell Wimp_TextOp 2 that we want to right-justify the text.
Finally, Wimp_TextOp 2 is called – passing the flags, the text pointer and the x and y screen coordinates. An inset up is applied to the vertical coordinate, in a similar way that we did conditionally for the horizontal position.
Returning to the redraw loop within results_redraw(), we have updated the code as seen in Listing 33.2.
static void results_redraw(wimp_draw *redraw)
{
        osbool more;
        int ox, oy, top, bottom, y0;

        /* Use the shape column to size the row heights. */

        int row_height = results_icons[RESULTS_ICON_TITLE_SHAPE].extent.y1 -
                        results_icons[RESULTS_ICON_TITLE_SHAPE].extent.y0;

        /* Redraw the window. */

        more = wimp_redraw_window(redraw);

        wimp_set_colour(wimp_COLOUR_BLACK);
        wimp_set_colour(wimp_COLOUR_VERY_LIGHT_GREY | 0x80u);

        while (more) {
                ox = redraw->box.x0 - redraw->xscroll;
                oy = redraw->box.y1 - redraw->yscroll;

                top = (oy - redraw->clip.y1) / row_height;
                if (top < 1)
                        top = 1;

                bottom = ((oy - redraw->clip.y0) - 1) / row_height;
                if (bottom > RESULTS_MAX_ROWS)
                        bottom = RESULTS_MAX_ROWS;

                if (bottom > results_row_count)
                        bottom = results_row_count;

                for (int y = top; y <= bottom; y++) {
                        y0 = oy - ((y + 1) * row_height);

                        results_plot_text(RESULTS_ICON_TITLE_SHAPE, ox, y0, results_rows[y - 1].shape);
                        results_plot_text(RESULTS_ICON_TITLE_SIDES, ox, y0, results_rows[y - 1].sides);
                        results_plot_text(RESULTS_ICON_TITLE_INTERNAL_ANGLES, ox, y0, results_rows[y - 1].internal_angle);
                        results_plot_text(RESULTS_ICON_TITLE_SIDE_LENGTH, ox, y0, results_rows[y - 1].side_length);
                        results_plot_text(RESULTS_ICON_TITLE_PERIMETER, ox, y0, results_rows[y - 1].perimeter);
                        results_plot_text(RESULTS_ICON_TITLE_AREA, ox, y0, results_rows[y - 1].area);
                }

                more = wimp_get_rectangle(redraw);
        }
}
Listing 33.2: Calling redraw_plot_text() from the redraw loop
Before calling Wimp_TextOp 2, we need to set the colours which it will use. These can be changed at any point if we need multi-colour text, but since we are only using black text we set this at the start of the redraw code. The use of anti-aliased outline fonts means that we must set the foreground and background colours. We can use either Wimp_TextOp 0 or Wimp_SetColour for this purpose, which OSLib defines as follows; we have chosen to use the latter.
extern void wimptextop_set_colour(
        os_colour fg,
        os_colour bg
);

extern void wimp_set_colour(
        wimp_colour colour
);
We need both the ox and oy screen coordinates for the work area origin, so we calculate these at the top of the outer redraw loop. For each line in the inner loop, we calculate the baseline y0 in screen coordinates, and then pass ox and y0 to each of the calls to results_plot_text().
If we compile the application with these changes, we can see from Figure 33.1 that there is little visible change.
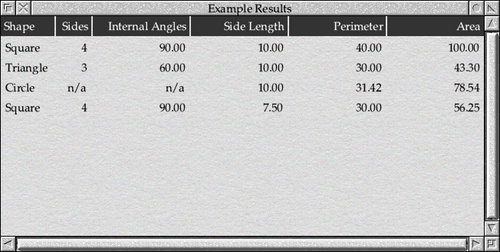
Figure 33.1: Plotting the rows of results using Wimp_TextOp
There is at least one important difference, however. If we adjust some of the column widths as we have in Figure 33.2, we can see that when plotting the table cells using Wimp_PlotIcon (as the window at the back is doing) the Wimp clips the text for us when it would otherwise spill outside of the area allowed for it. The version which uses Wimp_TextOp 2 (the window in fromt) does not do this as standard: it would be up to us to use the other Wimp_TextOp calls to calculate the widths of the strings and truncate them as necessary before plotting them. This may be something which swings the decision towards one or the other of the approaches.
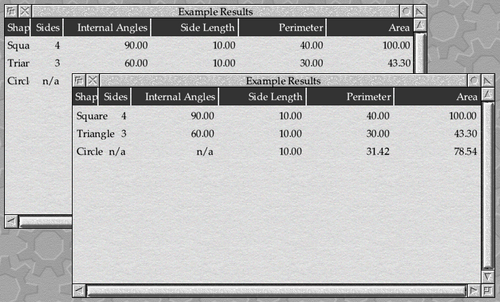
Figure 33.2: Wimp_PlotIcon clips to the icon area, while Wimp_TextOp doesn’t
The full application code with these changes included can be found in Download 33.1.
Going old-school
There’s no requirement to use any fancy Wimp calls to do the text plotting, however: it’s completely possible to use printf() for the job. The Wimp issues a VDU 5 before exiting from Wimp_RedrawWindow and Wimp_GetRectangle, so we can position the graphics cursor with a call to OS_Plot and print the text that we need using anything that calls one of the OS_Write family. Given the availability of Wimp_TextOp, OS_Font and Wimp_PlotIcon – not to mention the general use of a desktop font since RISC OS 3.5 – we should be clear that this probably isn’t something that a developer in the 21st Century should be considering. Nonetheless, it still remains an option if the need arises!
One potential issue with plotting text in the System Font is that the size of characters is dependent on the screen mode and eigenvalues that are currently in force, because as standard the font is 8 × 8 pixels in size regardless of the proportions of the current mode. This effect can still be seen in the old command window, an example of which can be seen in Figure 33.3 as displayed in a standard 90dpi mode.
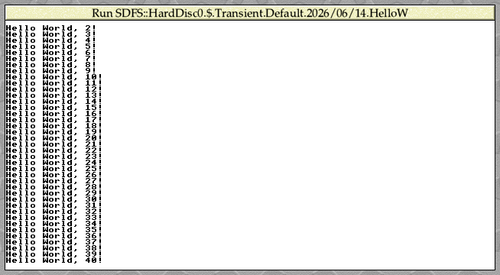
Figure 33.3: A command window in a 90dpi mode
If its appearance is compared to a command window being displayed in a high-resolution 180dpi mode, as seen in Figure 33.4, it can be seen that in the 180dpi mode the text appears to be very small – ‘half size’, in fact – compared to that in the standard 90dpi mode. This is due to the way that one pixel equals one OS unit on screen in the 180dpi mode, compared to there being two OS units per pixel in a 90dpi mode: meaning that the font occupies an area of twice as many square OS units in the 90dpi mode compared to the 180dpi one. The effect manifests in a different way when returning to the old rectangular-pixel modes, where the characters stretch upwards to be twice as high as they are wide, because there are now four OS units for every pixel vertically compared to two horizontally.
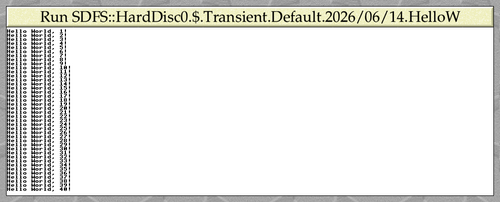
Figure 33.4: A command window in a 180dpi mode
The Wimp addresses this for applications which wish to plot text in the System Font by using VDU 23,17,7 to ensure that, when in VDU 5 mode, the font is plotted at 16 × 32 OS units regardless of the mode resolution. The settings are updated on a mode change, and applications are trusted not to issue their own VDU 23,17,7 commands afterwards! This means that we can safely write code like that seen in Listing 33.3, and rely on the text coming out the same regardless of the user’s chosen screen mode.
static void results_redraw(wimp_draw *redraw)
{
        osbool more;
        int ox, oy, top, bottom, y1;

        /* Use the shape column to size the row heights. */

        int row_height = results_icons[RESULTS_ICON_TITLE_SHAPE].extent.y1 -
                        results_icons[RESULTS_ICON_TITLE_SHAPE].extent.y0;

        /* Redraw the window. */

        more = wimp_redraw_window(redraw);

        wimp_set_colour(wimp_COLOUR_BLACK);

        while (more) {
                ox = redraw->box.x0 - redraw->xscroll;
                oy = redraw->box.y1 - redraw->yscroll;

                top = (oy - redraw->clip.y1) / row_height;
                if (top < 1)
                        top = 1;

                bottom = ((oy - redraw->clip.y0) - 1) / row_height;
                if (bottom > RESULTS_MAX_ROWS)
                        bottom = RESULTS_MAX_ROWS;

                if (bottom > results_row_count)
                        bottom = results_row_count;

                for (int y = top; y <= bottom; y++) {
                        y1 = oy - (y * row_height);

                        os_plot(os_MOVE_TO, ox + RESULTS_LINE_INSET, y1 - RESULTS_LINE_INSET);

                        printf("%-8s %4s  %14s  %14s  %14s  %14s",
                                        results_rows[y - 1].shape,
                                        results_rows[y - 1].sides,
                                        results_rows[y - 1].internal_angle,
                                        results_rows[y - 1].side_length,
                                        results_rows[y - 1].perimeter,
                                        results_rows[y - 1].area
                        );
                }

                more = wimp_get_rectangle(redraw);
        }
}
Listing 33.3: Redrawing the text using printf()
The call to OS_Plot puts the graphics cursor into the position where we want the top-left pixel of the first character to appear, as this is the origin used when printing in VDU 5 mode. This means that we’re calculating the vertical position of the top of the row and storing it in y1, instead of the bottom of the row in y0 as we’ve been doing before, and then subtracting an offset from that. We could have added an offset to y0, but that would have required us to consider the height of the text (although this should always be 32 OS units, as noted above).
The results seen in Figure 33.5 might look a bit nostalgic, but may well be all that is required for some quick-but-functional applications. It should be noted that some care was needed with spaces and field widths in the printf() format string in order to get the columns to line up – how robust this would be in different screen modes is another question! If we wanted more repeatability then we could, of course, make six calls to printf() for each line, and align each one to the appropriate column heading icon – but it’s quickly becoming a lot of effort compared to the icons in Download 32.3 from the previous chapter.
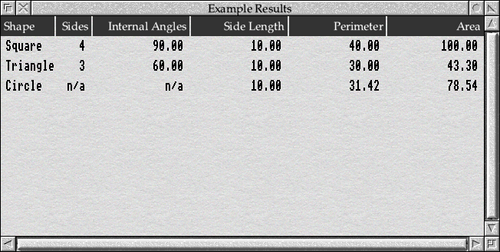
Figure 33.5: Outputting the results using printf()
The full application code with printf() can be found in Download 33.2.
Horizontal lines
Going back to the code that we had in Download 32.3, one thing that we might want to do is rule off each of the lines in the table so that our eye can follow more easily. We can do this using the line drawing capabilities of OS_Plot, as shown in Listing 33.4.
static void results_redraw(wimp_draw *redraw)
{
        osbool more;
        int oy, top, bottom, icon_y0, icon_y1;

        /* Use the shape column to size the row heights. */

        int row_height = results_icons[RESULTS_ICON_TITLE_SHAPE].extent.y1 -
                        results_icons[RESULTS_ICON_TITLE_SHAPE].extent.y0;

        /* Redraw the window. */

        more = wimp_redraw_window(redraw);

        while (more) {
                oy = redraw->box.y1 - redraw->yscroll;

                top = (oy - redraw->clip.y1) / row_height;
                if (top < 1)
                        top = 1;

                bottom = ((oy - redraw->clip.y0) - 1) / row_height;
                if (bottom > RESULTS_MAX_ROWS)
                        bottom = RESULTS_MAX_ROWS;

                if (bottom > results_row_count)
                        bottom = results_row_count;

                for (int y = top; y <= bottom; y++) {
                        icon_y1 = -(y * row_height);
                        icon_y0 = icon_y1 - row_height;

                        wimp_set_colour(wimp_COLOUR_VERY_DARK_GREY);

                        os_plot(os_MOVE_TO, redraw->clip.x0, oy + icon_y0);
                        os_plot(os_PLOT_TO, redraw->clip.x1, oy + icon_y0);

                        results_plot_icon(RESULTS_ICON_ROW_SHAPE, icon_y0, icon_y1, results_rows[y - 1].shape);
                        results_plot_icon(RESULTS_ICON_ROW_SIDES, icon_y0, icon_y1, results_rows[y - 1].sides);
                        results_plot_icon(RESULTS_ICON_ROW_INTERNAL_ANGLES, icon_y0, icon_y1, results_rows[y - 1].internal_angle);
                        results_plot_icon(RESULTS_ICON_ROW_SIDE_LENGTH, icon_y0, icon_y1, results_rows[y - 1].side_length);
                        results_plot_icon(RESULTS_ICON_ROW_PERIMETER, icon_y0, icon_y1, results_rows[y - 1].perimeter);
                        results_plot_icon(RESULTS_ICON_ROW_AREA, icon_y0, icon_y1, results_rows[y - 1].area);
                }

                more = wimp_get_rectangle(redraw);
        }
}
Listing 33.4: Plotting rule-off lines between the data
To do the plotting, we will need to know the horizontal and vertical positions of the ends of the lines in terms of screen coordinates. We can calculate the vertical position using the work area coordinate icon_y0, which is the baseline of the icons in the row, and adding it to the vertical work area origin oy. We could calculate the horizontal positions in a similar way, using the x0 and x1 coordinates of the work area extent and the horizontal work area origin ox that we have used in previous examples; there is, however, an easier option. For any given redraw rectangle that the Wimp supplies to us, we only need to plot a line from its left hand side to its right hand side. We can therefore use the clip rectangle, which the Wimp gives us in screen coordinates within the wimp_draw structure, and plot from redraw->clip.x0 to redraw->clip.x1.
Actually plotting the line below each of the rows is done with a call to Wimp_SetColour to select the foreground colour, followed by a couple of calls to OS_Plot to move and then plot the line. In each case, the screen coordinates for the plotting are calculated by adding the work area coordinates to the screen coordinates of the work area origin in the usual way. The result can be seen in Figure 33.6.

Figure 33.6: Drawing rule-offs with OS_Plot
The full code is available in Download 33.3.
Background effects
So far, we have been allowing the Wimp to draw the work area in the window’s background colour for us. A lot of the time this is useful and, in the case of windows whose background is wimp_COLOUR_VERY_LIGHT_GREY, it means that we get the standard textured window background plotted for us with no effort on our part. However, what if we wanted to do something like alternating coloured backgrounds for the rows?
If we set the window background to wimp_COLOUR_TRANSPARENT then, rather than making the window background transparent (which would be a neat trick that, unfortunately, the Wimp can’t perform), we actually tell the Wimp that we don’t want the work area cleared and filled for us: we can see this in action in Figure 33.7, when updating the template in WinEd. We can now plot the background for ourselves: saving any flicker being caused by the Wimp clearing and plotting its bacground, followed in quick succession by our application plotting over it in a different colour. A colour of wimp_COLOUR_TRANSPARENT will also work for windows which have their wimp_WINDOW_AUTO_REDRAW flag set, but it’s not much use in that situation as then nothing clears the background!
![]()
Figure 33.7: Setting the window work area background to transparent
The code to redraw the window can be seen in Listing 33.5. There should be few surprises after the previous examples, but there are still a few points of interest.
static void results_redraw(wimp_draw *redraw)
{
        osbool more;
        int oy, top, bottom, icon_y0, icon_y1;

        /* Use the shape column to size the row heights. */

        int row_height = results_icons[RESULTS_ICON_TITLE_SHAPE].extent.y1 -
                        results_icons[RESULTS_ICON_TITLE_SHAPE].extent.y0;

        /* Redraw the window. */

        more = wimp_redraw_window(redraw);

        while (more) {
                oy = redraw->box.y1 - redraw->yscroll;

                top = (oy - redraw->clip.y1) / row_height;
                if (top < 0)
                        top = 0;

                bottom = ((oy - redraw->clip.y0) - 1) / row_height;
                if (bottom > RESULTS_MAX_ROWS)
                        bottom = RESULTS_MAX_ROWS;

                for (int y = top; y <= bottom; y++) {
                        icon_y1 = -(y * row_height);
                        icon_y0 = icon_y1 - row_height;

                        wimp_set_colour((y % 2) ? wimp_COLOUR_WHITE : wimp_COLOUR_LIGHT_GREY);

                        os_plot(os_MOVE_TO, redraw->clip.x0, oy + icon_y0);
                        os_plot(os_PLOT_TO | os_PLOT_RECTANGLE, redraw->clip.x1 - 1, oy + icon_y1 - 1);

                        if (y < 1 || y > results_row_count)
                                continue;

                        results_plot_icon(RESULTS_ICON_ROW_SHAPE, icon_y0, icon_y1, results_rows[y - 1].shape);
                        results_plot_icon(RESULTS_ICON_ROW_SIDES, icon_y0, icon_y1, results_rows[y - 1].sides);
                        results_plot_icon(RESULTS_ICON_ROW_INTERNAL_ANGLES, icon_y0, icon_y1, results_rows[y - 1].internal_angle);
                        results_plot_icon(RESULTS_ICON_ROW_SIDE_LENGTH, icon_y0, icon_y1, results_rows[y - 1].side_length);
                        results_plot_icon(RESULTS_ICON_ROW_PERIMETER, icon_y0, icon_y1, results_rows[y - 1].perimeter);
                        results_plot_icon(RESULTS_ICON_ROW_AREA, icon_y0, icon_y1, results_rows[y - 1].area);
                }

                more = wimp_get_rectangle(redraw);
        }
}
Listing 33.5: Adding highlighting to alternate rows
The first thing to note is that with no work area background being plotted by the Wimp, we will now need to redraw the space behind the title icons: to achieve this, we change the bounds checks at the start of the while () loop. The test which clipped the minimum value of top to 1 has been changed so that the value can go down to 0: this way, the title row will be included in the for () loop. At the other end, we need to plot a background for all of the empty rows below the data, so the comparison of bottom with results_row_count has been removed.
The rectangle plotting is done using OS_Plot, in a similar way to that in which we plotted the rule-off lines before. The call to Wimp_SetColour now selects one of wimp_COLOUR_WHITE or wimp_COLOUR_LIGHT_GREY depending on whether the row number is odd or even. After the background has been drawn, we do a bounds check on y to skip the icon plotting if we are outside the range of the available data. The result can be seen in Figure 33.8.
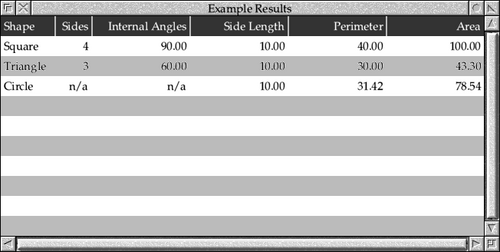
Figure 33.8: Plotting alternate row highlights
There are a couple of other potential ‘gotchas’ in the code. If we look closely at the calls to OS_Plot, we can see that there are a couple of extra −1s in the second line.
os_plot(os_MOVE_TO, redraw->clip.x0, oy + icon_y0);
os_plot(os_PLOT_TO | os_PLOT_RECTANGLE, redraw->clip.x1 - 1, oy + icon_y1 - 1);
Unlike the Wimp, OS_Plot includes the x1 and y1 coordinates in its plotting area, so we need to make sure that we compensate for the fact that the coordinates from the Wimp exclude these pixels. If we remove these adjustments, then we can see in Figure 33.9 that the edges of the rows can move up and down by a pixel if the edges of the clip window interact with them. It’s always a good idea to check the operation of redraw code carefully, including when other windows or menus are dragged over the window one pixel at a time.
Figure 33.9: Redraw artifacts in the window
The other thing that we can see in Figure 33.9 is that the anti-aliasing of the text on the grey rows isn’t quite right. It turns out that, due to the changes made to the Wimp to make themes look good, we can’t rely on being able to control the background colour of a font when plotting it in an unfilled icon. We could set the background colour of the icon definition before calling Wimp_PlotIcon, but there is no guarantee that it will be respected – because in a lot of cases, where applications haven’t set the ‘invisible’ colour correctly, this won’t actually be what the user wants to happen. In practice, if we will be plotting text over different colour background like this, we would probably be better off using Wimp_TextOp 2 instead of Wimp_PlotIcon and setting the background colour that way.
With that said, the code for the example can be found in Download 33.4.
Use your imagination
Window redraw is a huge topic, and there are many things that can be done by an application to display content within its windows. There is no way that we can cover everything here, but hopefully the last three chapters have given you some inspiration and both the building blocks and tools needed to implement the code that you need for your own projects.
For now, though, we must leave the vast topic of window redraw behind and move on to something completely different.